Saturday, December 9, 2023

Map Topology and How to Correct Topology Error in Vector Data?

 πŸ—Ί️ Mastering Map Topology: Keeping GIS Data in Check! 🌐

· Map topology refers spatial relationship between the vector feature
· It defines how points, lines, and polygons relate to one another ensuring the accuracy and integrity of our spatial data.
· Map topology correction ensure the error free vector data

How to Remove Topology Errors

Identify Errors: Run topology checks to spot issues.
Edit Geometries: Adjust feature shapes to eliminate errors.
Snap Vertices: Use snapping tools for precise alignment.
Merge or Split Features: Ensure proper connectivity.
Validate and Update: Re-run checks, validate changes, and update the dataset.
Maintain Data Integrity: Regularly perform checks to keep spatial data in top shape.

#GIS #SpatialData #DataQuality #DataIntegrity #Geospatial #DataScience #MapTopology #Topology #VectorData #TopologyCorrection #TopologyError #VectorError #DataValidation #Learnwithleo
Map Topology Error

#GIS #SpatialData #DataQuality #DataIntegrity #Geospatial #DataScience #MapTopology #Topology #VectorData #TopologyCorrection #TopologyError #VectorError #DataValidation #Learnwithleo

Friday, December 8, 2023

What is 2D, 3D and 4D in Spatial Data Types?

 πŸš€ Exploring Dimensions in Spatial Data: 2D, 3D, and 4D! 🌐

2D (Two-Dimensional)
πŸ“  In 2D spatial data, information is represented on a flat plane, typically using x and y coordinates. This is the most common form of spatial data and is suitable for mapping and analyzing features like points, lines, and polygons on a mapπŸ—Ί️ 

3D (Three-Dimensional)
πŸŒ† 3D spatial data introduces the third dimension, usually representing elevation or depth. It adds a z-coordinate to the x and y coordinates, allowing for the representation of features in three-dimensional space. Common applications include 3D buildings, terrain modeling, and subsurface mapping.🏑

4D (Four-Dimensional)
πŸ”„ 4D spatial data extends into the temporal dimension, adding time as a variable. This type of data represents changes and dynamics over time in addition to the three spatial dimensions. Applications include time-series data, dynamic GIS datasets, and scenarios where understanding temporal evolution is crucialπŸ“†. 

Examples:
🌍 2D: Mapping a city's landmarks, roads, and administrative boundaries.
πŸ™️ 3D: Modeling a cityscape with dynamic, three-dimensional structures.
πŸ”„ 4D: Tracking urban growth and changes in building structures over time.

#SpatialData #GIS #DigitalTransformation #DataAnalytics #Geospatial #SpatialDataDimension #2D #3D #4D #VectorData #VectorDimentions #Learnwithleo

2D and 3D Vector Example

πŸ”— #SpatialData #GIS #DigitalTransformation #DataAnalytics #Geospatial #SpatialDataDimension #2D #3D #4D #VectorData #VectorDimentions #Learnwithleo πŸš€

Thursday, December 7, 2023

Spatial Data Types

🌍 Spatial Data Types in GIS! πŸ—Ί️

Spatial data types refer to the different representations of spatial information used in geographic information systems (GIS) and other applications that involve the analysis and visualization of spatial data.

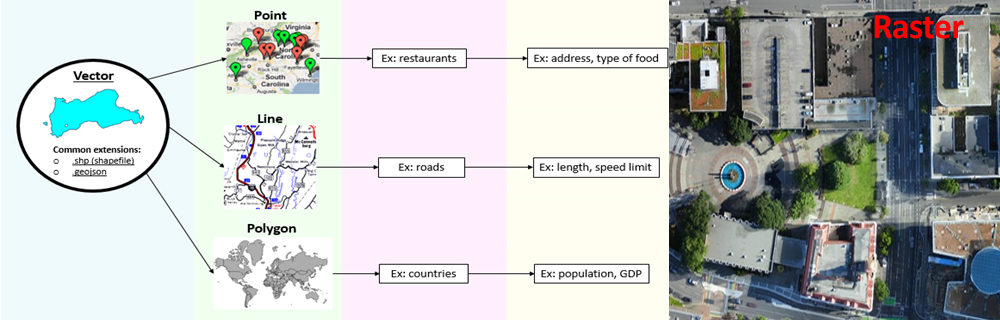
πŸ™️Vector Data

πŸ“ Points: Points are elements composed of two coordinates, X and Y, often corresponding to longitude and latitude (wells, houses, etc., are represented by points)

πŸ›€️Lines/Polylines: Lines are composed of one or more pairs of points connected that define line segments (roads, rivers, streams, etc., are represented by lines)

🌐 Polygons: Polygons are formed by a set of connected lines where the start and end a point have the same coordinate and the interior of the polygon may implied (villages, towns, water body, land parcels, etc., are represented by polygons)

πŸ“Š Raster Data

• Raster data are composed of grid cells identified by row and column
• The geographic area is divided into groups of individual cells, which represent in an image
• Satellite images, photographs, scanned images are the examples of raster data generally stored in tiff or JPG format
• Raster data is used to visualized continuous data like Elevation and Rainfall intensity

#GIS #SpatialData #DataTypes #Geography #DigitalTransformation #Point #Line #Polyline #RemoteSensingDateType #Polygon #Raster #learnwithleo

Spatial Data Types

#GIS #SpatialData #DataTypes #Geography #DigitalTransformation #Point #Line #Polyline #RemoteSensingDateType #Polygon #Raster #learnwithleo

Wednesday, December 6, 2023

What is Radiometric Resolution in Remote Sensing?

 πŸ“‘ What is Radiometric Resolution in Remote Sensing Imagery! 🌐

• 🎨 Radiometric Resolution in remote sensing refers to the ability of a sensor to differentiate between various levels of brightness or reflectance in an acquired image.

• πŸ’‘ Radiometric Resolution refers to the smallest change in intensity level that can be detected by the sensing system

• πŸš€ It simply refers bit per pixel of Remote Sensing image stored

• πŸ’» 8 bits = 256 levels (usually 0 to 255) 16 bits = 65,536 levels (0 to 65,535)

• πŸ”— Traditionally 8-bit data was common in Remote Sensed image

#RemoteSensing #RadiometricResolution #EarthObservation #GIS #DataAnalysis #SpatialData #DigitalImageBitSize #ImageRadiometry #ColorIntensity #Learnwithleo

Radiometric Resolution in Remote Sensing

#RemoteSensing #RadiometricResolution #EarthObservation #GIS #DataAnalysis #SpatialData #DigitalImageBitSize #ImageRadiometry #ColorIntensity #Learnwithleo


Tuesday, December 5, 2023

What is Temporal Solution in Remote Sensing?

🌐 What is Temporal Resolution in Remote Sensing πŸ›°️

πŸ•°️Temporal Resolution is defined as the amount of time needed to revisit and acquire spatial data for the exact same location.

πŸ•°️Temporal Resolution in remote sensing refers to the frequency at which a sensor or satellite revisits and captures data for a particular location on the Earth's surface over time. It is a critical parameter that describes how often a satellite can collect information about the same area.

πŸš€Temporal Resolution is measured in terms of time units, such as hours, days, or weeks.

πŸ”„A higher Temporal Resolution means that a sensor can revisit the same location more frequently, providing more frequent updates on changes occurring on the Earth's surface. This is particularly important for monitoring dynamic processes, such as land cover changes, vegetation growth, and urban growth analysis, disaster damage assessment other temporal variations.

🚁Drone can be deployed immediately, so the image from drone has very high temporal resolution.

#RemoteSensing #TemporalResolution #EarthObservation #GIS #DataScience #EnvironmentalMonitoring #UrbanGrowth #ChangeDetection #SatelliteImagery #RevisitPeriod #DroneImagery #Learnwithleo

Temporal Resolution in Remote Sensing

#RemoteSensing #TemporalResolution #EarthObservation #GIS #DataScience #EnvironmentalMonitoring #UrbanGrowth #ChangeDetection #SatelliteImagery #RevisitPeriod #DroneImagery #Learnwithleo

Monday, December 4, 2023

Spectral Resolution in Remote Sensing?

🌐 What is Spectral Resolution in Remote Sensing! πŸ›°️

        1. Spectral Resolution refers to a sensor's capability to distinguish between different wavelengths of electromagnetic radiation. Whether it's visible light, infrared, or microwave, each wavelength holds unique information about our planet

        2. Spectral Resolution refers to how many spectral “Bands” a remote sensing sensor records

        3. Spectral Resolution is also defined by how “Wide” each band is or the range of wavelengths covered by a single band

🎨 What Spectral Image does in Remote Sensing πŸš€

    Characterized by the number and width of spectral bands, higher spectral resolution empowers sensors to discern more narrow bands. This allows for a more detailed analysis of the spectral characteristics of observed objects, leading to applications in vegetation monitoring, mineral identification, land cover classification, and environmental studies.

Based on number of spectral wavelength and band the Remote Sensing images are classified in to 4 types

                        --> Panchromatic (0.4Β΅m-0.9 Β΅m)
                        --> Visible (0.4 Β΅m -0.7 Β΅m)
                        --> Multispectral
                        --> Hyperspectral

#RemoteSensing #EarthObservation #SpectralResolution #DataAnalysis #GIS #EnvironmentalScience #Multispectral #Hyperspectral #SatelliteImagery #SpectralBand #Learnwithleo

Spectral Band in Remote Sensing Images

#RemoteSensing #EarthObservation #SpectralResolution #DataAnalysis #GIS #EnvironmentalScience #Multispectral #Hyperspectral #SatelliteImagery #SpectralBand #Learnwithleo


Thursday, November 30, 2023

What is Spatial Resolution or GSD in Remote Sensing?


🌍 What is Spatial Resolution in Remote Sensing πŸ›°

  • Spatial resolution or Ground Sample Distance (GSD) is a key factor in remote sensing, defining the level of detail captured in an image.
  • The spatial resolution specifies the pixel size of images from Remote Sensing sensor corresponding to coverage area in the earth surface.
  • It is depending on the sensor width, focal length and the altitude at which the images are captured.
  • It simply refers the visual clarity of the earth images captured by the remote sensing sensor or how much detail in image is visible to the human eye to distinguish the earth feature.

The picture described about spatial resolution of remote sensing image
Spatial Resolution in Remote Sensing Image

From the above picture 0.3-meter resolution is consider as high spatial resolution image because one pixel represents one 30 centimeter object in ground.
#RemoteSensingInsights #SpatialResolution #Geospatial #SatelliteVision #RemoteSensingTech #HighResolutionMapping #EarthObservation #GIS #DataScienceInEarthMonitoring #GSD #AerialSurvey #RemoteSensingImage #AerialImageAcqusition #DroneMapping #AerialMapping #Learnwithleo


Wednesday, November 29, 2023

Types of Remote Sensing


πŸ“‘Types of Remote SensingπŸ“·

Remote Sensing is classified based on Energy Source 

  •  Active Remote Sensing
  •  Passive Remote Sensing 
Images shows remote sensing types
Remote Sensing Types

1. Active Remote Sensing
  • Active sensors emit their own energy in order to scan objects and areas whereupon a sensor then detects and measures the radiation that is reflected or backscattered from the target
  • RADAR, Ultrasonic and LiDAR technologies are working under Active Remote Sensing technique
  • In Active Remote Sensing, the energy is generated using artificial devices
2. Passive Remote Sensing
  • Incident solar energy (energy from sun) is absorbed, reflected and transmitted by the object
  • The reflected solar energy was detected by the sensor is called Passive Remote Sensing
  • RGB camera, multispectral camera and thermal camera-based aerial image acquisition is the best example for passive remote sensing
  • It requires sunlight as source. so that the data acquisition can’t be done at night time under this technique
#RemoteSensingTypes #ActiveRemoteSensing #PassiveRemoteSensing #Radiation #LiDAR #SolarEnergy #RemoteSensingSensor #Multispectral #AerialImage #ImageAcqusition #AerialSurvey #AerialMapping

Tuesday, November 28, 2023

Remote Sensing Electromagnetic Spectrum


🌐 Remote Sensing Electromagnetic SpectrumπŸ›°️

  • Electromagnetic energy travels in an atmosphere as wave that are measured in wavelength and at speed measured by frequency 109
  • Wavelength is the mean distance between maximums or minimums of a roughly periodic pattern and it is normally measured in micrometers (um) or nanometers (nm 10-9)
  • Frequency is the number of wavelengths that pass a point per unit time

Images shows various electromagnet spectrum and its frequency

Remote Sensing Electromagnet Spectrum

Based on wavelength region the remote sensing classified into 3 major types

1. Visible and Infrared Remote Sensing

2. Thermal Infrared Remote Sensing

3. Microware Remote Sensing

Table 1 Remote Sensing Electromagnetic Spectrum Table

SNo

Name

Wavelength(nm)

1

Optical Wavelength

0.30-15

2

Reflective

1. Visible

2. Near IR

3. Mid IR


0.38-0.72

0.72-1.30

1.30-3.0

3

Far IR(Thermal and Emissivity)

7.0-15


#RemoteSensingSpectrum #ElectromagneticSpectrum #ElectromagneticWaves #Wavelength #Frequency #ThermalInfraRed #Infrared #Microwave

Sunday, November 26, 2023

Energy Balance in Remote Sensing


πŸ›°️Energy Balance in Remote Sensing?! πŸŒŸπŸ€”

  • When the energy falls on the object that energy is neither absorbed nor reflected or transmitted
  • The reflected energy recorded by the sensor helps to identify the details about the object
  • The amount of reflected energy depends upon the property of the object (physical, structural, and chemical components)

Images show how the electromagnetic energy is absorbed, reflected and transmitted by the object on ground
Remote Sensing Energy Balance


#RemoteSensing #Energy #EarthScience #Environment #Technology #Geospatial #Mapping #AerialPhotography #Drones #DataCollection #DroneImageProcessing #AerialMapping  #Learnwithleo



Saturday, November 25, 2023

What are the Remote Sensing Components?


πŸ›°️🌐Remote Sensing ComponentsπŸŒŸπŸ€”

Remote Sensing components are determined by sensing the reflected or emitted energy from the object also, processing, analyzing and applying that information for environmental applications

Image shows various remote sensing component and it connectivity
Remote Sensing Component Life-Cycle 

A - The energy source provides the electromagnetic energy source to the target. The sources may be from sun or manmade sensors

B – Radiation and Atmosphere - It is the media by which the energy is transmitted to the target

C – Energy Interacts with the target – It is depending on the target’s physical, structural, and chemical components

D – Recording Reflected Energy by Sensor - Sensor records the transmitted, emitted or absorbed energy by the target

E & F - Transmission, Reception and Data generation – The energy recorded by the sensor has been transmitted to the receiving and processing station where the data are processed as an image

G - Data Analysis – In this stage, the images are processed, analyzed and visualized to extract the information about object

H - Data Product and Applications – Finally, the outcome of analyzed images is the data product and it is used for spatial decision-making purposes

Example

1. The visible radiation from the sun transmitted via the atmosphere that is absorbed and reflected by objects in our earth

2. The Transmitted energy recorded by optical remote sensing satellite, and the recorded data where transmitted to ground station, as signals where, they are converted as image

3. The converted images are processed and analyzed than the GIS data product such as Land Use / Land Cover Map has been generated which is used for various spatial decision making

#RemoteSensing #EarthScience #Environment #Technology #RemoteSensingComponent #Radiation #GIS #Geospatial #Mapping #AerialPhotography #Drones #DataCollection #DroneImageProcessing #AerialMapping #Learnwithleo


What is Remote Sensing?


πŸ›°️ What is Remote Sensing?! πŸŒŸπŸ€”

  • Remote Sensing means acquiring information from distance. 
  • It is an science and technology of obtaining information about an object without any physical contact with-it typically from satellites, aircraft, drones or from any ground-based sensor.
  • These sensors can capture various forms of energy, such as visible light, infrared radiation, microwave signals, and more, to create images and datasets that can be analyzed and interpreted for various purposes. The example for Remote Sensing observations is given below
Images shows different types of example for Remote Sensing Observation
Example for Remote Sensing Observation

#RemoteSensing #EarthScience #Environment #Technology #Geospatial #Mapping #AerialPhotography #Drones #DataCollection #DroneImageProcessing #AerialMapping  #Learnwithleo #WhatisRemoteSensing