Showing posts with label GIS. Show all posts

Saturday, December 9, 2023

Map Topology and How to Correct Topology Error in Vector Data?

 🗺️ Mastering Map Topology: Keeping GIS Data in Check! 🌐

· Map topology refers spatial relationship between the vector feature
· It defines how points, lines, and polygons relate to one another ensuring the accuracy and integrity of our spatial data.
· Map topology correction ensure the error free vector data

How to Remove Topology Errors

Identify Errors: Run topology checks to spot issues.
Edit Geometries: Adjust feature shapes to eliminate errors.
Snap Vertices: Use snapping tools for precise alignment.
Merge or Split Features: Ensure proper connectivity.
Validate and Update: Re-run checks, validate changes, and update the dataset.
Maintain Data Integrity: Regularly perform checks to keep spatial data in top shape.

#GIS #SpatialData #DataQuality #DataIntegrity #Geospatial #DataScience #MapTopology #Topology #VectorData #TopologyCorrection #TopologyError #VectorError #DataValidation #Learnwithleo
Map Topology Error

#GIS #SpatialData #DataQuality #DataIntegrity #Geospatial #DataScience #MapTopology #Topology #VectorData #TopologyCorrection #TopologyError #VectorError #DataValidation #Learnwithleo

Friday, December 8, 2023

What is 2D, 3D and 4D in Spatial Data Types?

 🚀 Exploring Dimensions in Spatial Data: 2D, 3D, and 4D! 🌐

2D (Two-Dimensional)
📍  In 2D spatial data, information is represented on a flat plane, typically using x and y coordinates. This is the most common form of spatial data and is suitable for mapping and analyzing features like points, lines, and polygons on a map🗺️ 

3D (Three-Dimensional)
🌆 3D spatial data introduces the third dimension, usually representing elevation or depth. It adds a z-coordinate to the x and y coordinates, allowing for the representation of features in three-dimensional space. Common applications include 3D buildings, terrain modeling, and subsurface mapping.🏡

4D (Four-Dimensional)
🔄 4D spatial data extends into the temporal dimension, adding time as a variable. This type of data represents changes and dynamics over time in addition to the three spatial dimensions. Applications include time-series data, dynamic GIS datasets, and scenarios where understanding temporal evolution is crucial📆. 

Examples:
🌍 2D: Mapping a city's landmarks, roads, and administrative boundaries.
🏙️ 3D: Modeling a cityscape with dynamic, three-dimensional structures.
🔄 4D: Tracking urban growth and changes in building structures over time.

#SpatialData #GIS #DigitalTransformation #DataAnalytics #Geospatial #SpatialDataDimension #2D #3D #4D #VectorData #VectorDimentions #Learnwithleo

2D and 3D Vector Example

🔗 #SpatialData #GIS #DigitalTransformation #DataAnalytics #Geospatial #SpatialDataDimension #2D #3D #4D #VectorData #VectorDimentions #Learnwithleo 🚀

Thursday, December 7, 2023

Spatial Data Types

🌍 Spatial Data Types in GIS! 🗺️

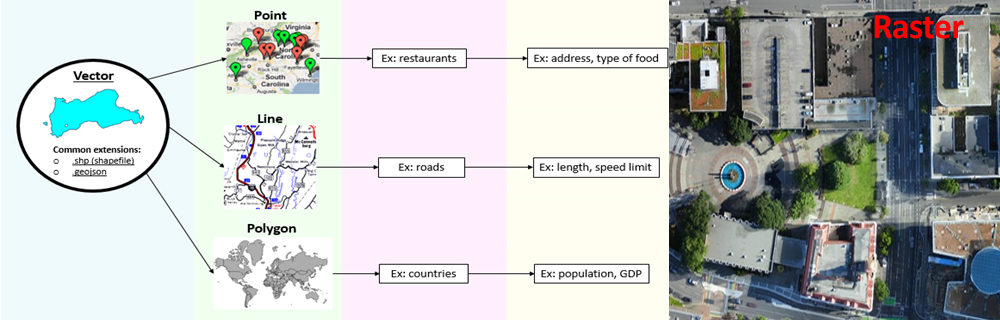
Spatial data types refer to the different representations of spatial information used in geographic information systems (GIS) and other applications that involve the analysis and visualization of spatial data.

🏙️Vector Data

📍 Points: Points are elements composed of two coordinates, X and Y, often corresponding to longitude and latitude (wells, houses, etc., are represented by points)

🛤️Lines/Polylines: Lines are composed of one or more pairs of points connected that define line segments (roads, rivers, streams, etc., are represented by lines)

🌐 Polygons: Polygons are formed by a set of connected lines where the start and end a point have the same coordinate and the interior of the polygon may implied (villages, towns, water body, land parcels, etc., are represented by polygons)

📊 Raster Data

• Raster data are composed of grid cells identified by row and column
• The geographic area is divided into groups of individual cells, which represent in an image
• Satellite images, photographs, scanned images are the examples of raster data generally stored in tiff or JPG format
• Raster data is used to visualized continuous data like Elevation and Rainfall intensity

#GIS #SpatialData #DataTypes #Geography #DigitalTransformation #Point #Line #Polyline #RemoteSensingDateType #Polygon #Raster #learnwithleo

Spatial Data Types

#GIS #SpatialData #DataTypes #Geography #DigitalTransformation #Point #Line #Polyline #RemoteSensingDateType #Polygon #Raster #learnwithleo